Insights is a SmartBrief Education Originals column that features perspectives from noted experts and leaders in education on the hot-button issues affecting schools and districts. All contributors are selected by the SmartBrief Education editorial team.

The latest Nation’s Report Card from the National Assessment of Educational Progress has painted a grim picture of the effects of the pandemic on learners across the nation. Both fourth- and eighth-grade students saw the largest decline in average math scores in the history of the assessment, just to cite one particularly worrying result. But when we look more closely at how students are doing by grade or demographic, we also see reasons for hope in learning recovery.
At Renaissance, we’ve been collecting data from student assessments to create the “How Kids Are Performing” reports. The goal is to help educators understand how to accelerate learning for their students. The latest report highlights a number of bright spots.
The nation’s schools may not be out of the woods yet, but based on our data from millions of K-12 assessments, it’s clear that the hard work that has been and continues to be done by educators and students is beginning to pay off.
Looking beyond the averages
When you look at an average, especially of a large set of data, all kinds of things may be hidden behind it. At the beginning of the pandemic, some averages told more of the story than any do now. But as the pandemic and recovery have progressed, more and more stories became hidden behind the averages — some hopeful and others concerning.
Imagine the cockpit of an airplane with dozens of dials representing different grades and demographics. All need to be pointing up,but right now some are pointing up, some are pointing to one side or the other, and some are still pointing down. This round of “How Kids Are Performing Reports” has seen more variance in which way those various dials are pointing than previous reports have noted. Many metrics suggest that educators have been looking at data about pandemic learning disruptions and taking action to address the areas of greatest need. There has been progress in learning recovery, but there is also still work to do.
At the beginning of the pandemic, losses were far more equal across different groups, regardless of socioeconomic status, race and other factors. As time has gone on and educators have responded, these effects have become more varied. Compounding factors, such as the subject being assessed or the grade students are in, have added even more variance.
If you were flying a plane through terrible turbulence and you lost altitude, the first question you’d have to answer is whether you’ve leveled off. When the pandemic hit, we saw a huge drop in educational altitude that initial spring. If you were in that plane, you felt your stomach hit your throat. Hard. And the loss of altitude continued into the next year in proportion to the many disruptions schools faced.
This year, the airplanes representing some subjects and grade levels are starting to level off. The kindergartners’ plane is even beginning to climb, and it looks like the other planes will join them shortly. The caveat to this is that some students — in particular, high-school juniors and seniors — have very little time to pull up the noses of their planes.
Learning recovery in math shows promise
The best-case scenario for student performance is a U-shaped learning recovery: There was a dip, it leveled off and now it’s beginning to rise again, indicating that the low point is in the past. All the grades that show a U-shaped recovery in our report are in elementary school, which is a hopeful sign for our youngest students.
Differences increase when the data is broken down by subject. Math was affected more than reading, likely because it is so cumulative. If students missed anything during the learning disruptions, its cumulative nature made it much harder for them to keep up as they tried to move forward. Additionally, many students’ math knowledge from existing grades probably looked a bit like Swiss cheese before the pandemic, and those holes were enlarged and compounded by school shutdowns and other disruptions.
But there is some good news here. Though students saw greater losses in math, the rebound has been promising. In fact, in our latest report, many grade-level student growth percentiles, or SGPs, were in a pretty typical range of 48 to 52, with 50 representing perfectly average growth. Some SGPs were even higher.
Student Growth Percentile Results and Change From Prior Year
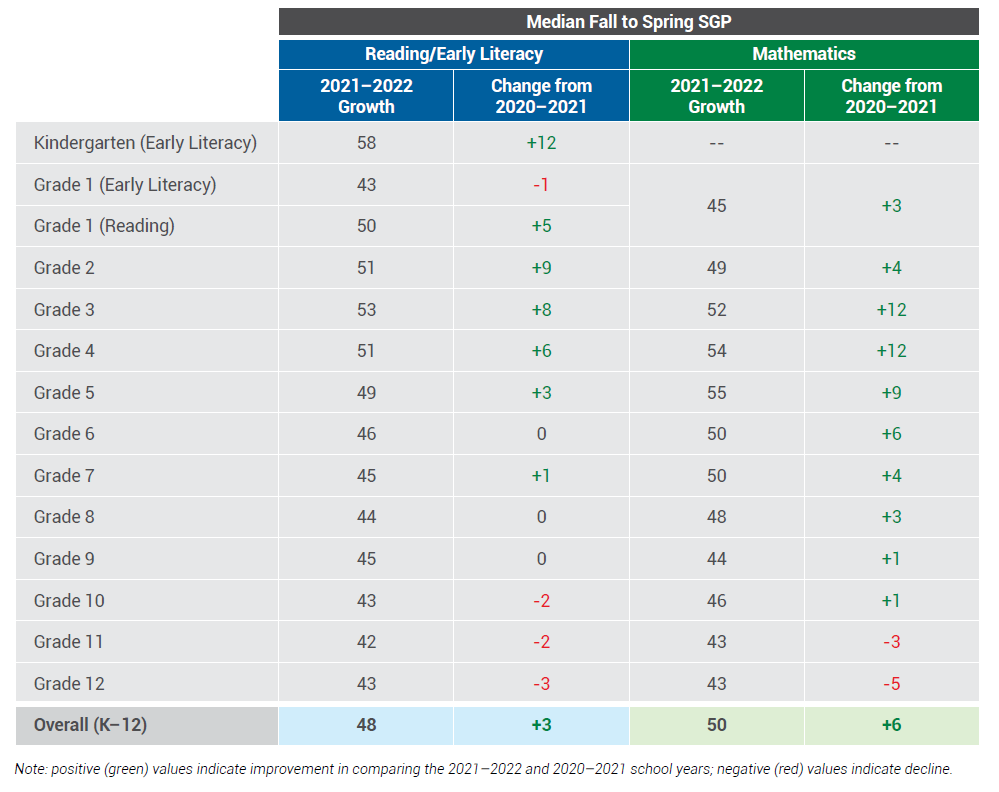
While the numbers need to be higher still in order to realize substantive gains, taken on their own, students had a very solid year of math growth during 2021–22. In particular, students of Pacific Islands heritage were a shining star of progress, picking up 15 SGP points to end at 54, which is both a nice gain and a nice place to end up.
Learning recovery in reading needs more work
Reading still lags, with SGPs ranging from 42 to 49, but even this could indicate something positive. It is possible that educators saw that math was more affected by learning disruptions, so they focused more of their learning recovery efforts on math than reading. Or, given the scale of the impacts, it may simply be that recovery is going to require continued focus over several seasons.
Within the reading results, most demographic groups had higher SGPs than the previous school year. Nonetheless, some SGP scores are still concerning. Black students, for example, had an average SGP of 42. While that’s an eight-point rise from the previous school year — the largest among all demographic groups! — this number indicates that Black students are continuing to lose altitude.
Kindergartners are faring well
Kindergartners had a fantastic year, picking up 12 points on their SGPs, on average. While students in kindergarten during the 2021–22 school year didn’t have the same kind of learning disruptions as their older peers, many of them had less exposure to formal programs prior to beginning school, meaning that they probably learned less about things like shapes and numbers and thus had some catching up to do.
Alli Pratt, a kindergarten teacher at Northern Hills Elementary School, explained some of the challenges of the past two years.
“[Very little] group work or collaboration was possible — a very important piece of kindergarten activities. Many manipulatives and hands-on materials had been taken away, and there was no free-play time allowed to support social or problem-solving skills with exploring, creating or building. Free time was spent at the desks doing paperwork or working individually on a Chromebook,” she said.
Pratt added that masking “made it difficult to receive and understand information and directions as well as to develop speech and language skills, and letter, sound and phonics development.
“How does a brain build a secure network to accomplish this when one cannot see or hear adequately because all mouths are covered and everyone is six feet apart from each other?” she wondered. “Personal connections were few and weak due to fear of touch and closeness. Young children need connections to thrive.”
Like all students, Pratt’s kindergarteners brought their post-pandemic emotional concerns with them to school, but like most young children, they proved to be incredibly resilient. Because their teacher met them with the right lessons and support, her class flourished.
Learning recovery shows gains, but more need to be made
While there are many bright spots in our latest report, we cannot look at the data through rose-colored glasses and say that the learning recovery is, by any means, complete. Rather, we need to continue supporting educators and students in their hard work.
The best news to come out of this report is the multiple examples of increased growth rates and beginnings of learning recovery. These indicate that many educators have been reviewing performance data and are working to address students’ needs, to great effect. Our work is simply not yet done.
Gene Kerns, Ed.D., is the chief academic officer at Renaissance, which compiles the “How Kids Are Performing” report. He has served as a public school teacher, adjunct faculty member, professional development trainer, district supervisor of academic services and academic advisor at a top edtech company. He also has trained and consulted internationally and is the co-author of three books. He can be reached at [email protected] or @GeneKerns.
Opinions expressed by SmartBrief contributors are their own.
_________________________
Subscribe to SmartBrief’s FREE email newsletter to see the latest hot topics on EdTech. It’s among SmartBrief’s more than 250 industry-focused newsletters.